viewport for Tessel

A Tessel library

Pan, zoom and rotate for Tessel canvases.

For drawings, plans, maps, plots and pictures. A Viewport turns metres, pixels or degrees into points on a Canvas and back, and handles the mouse and keys the way drawing programs do. Grids, rulers and scale bars follow the zoom.

tessel add viewport

MIT licence · Tessel 0.10 or later · no dependencies

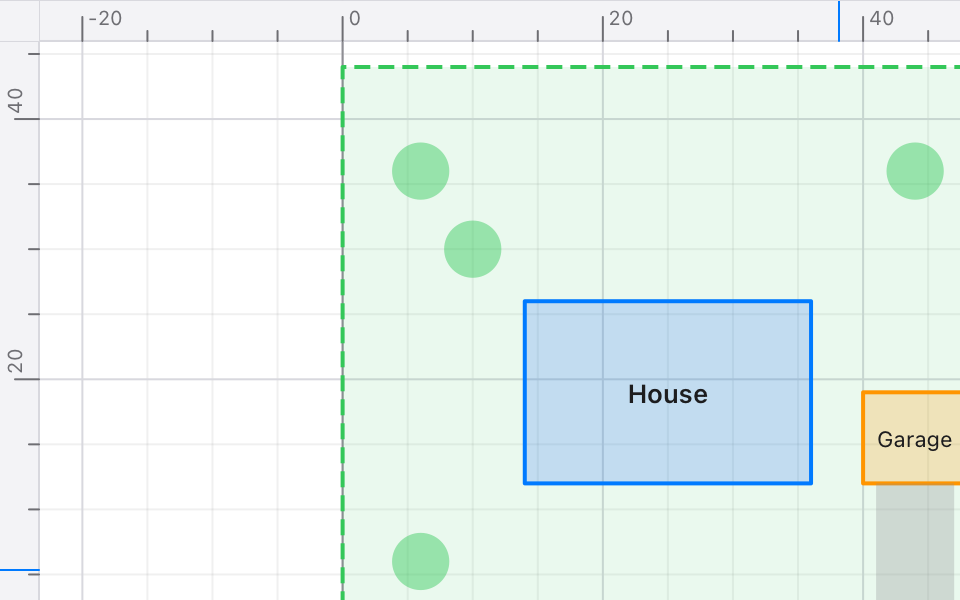
The example app: a site plan with a lot, a house, a garage and a street, a grid, rulers along the top and left with a blue mark at the mouse, a scale bar and a north arrow

What it does

Every picture here is the example app that comes with the library, run by Tessel without a window and saved.

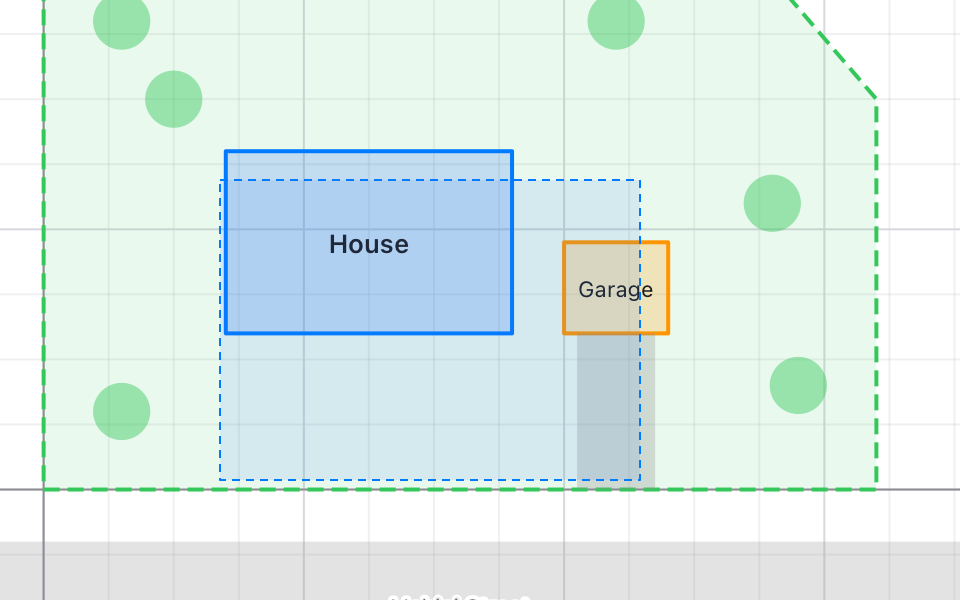
A dashed blue box dragged over the house and the driveway of the site plan

Zoom about the mouse, or into a box

The wheel and a pinch zoom about the point under the mouse, which stays where it is. Shift and a drag draws a box, and the view zooms smoothly until the box fills it. A double click fits the whole drawing again.

.onPointer { e in
    let _used = vp.handle(e)
}
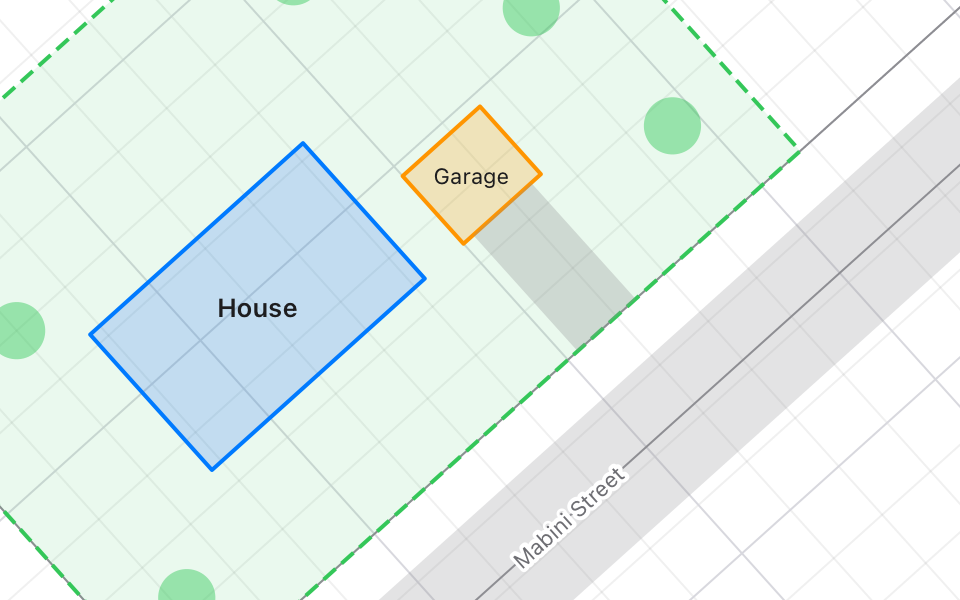
The site plan turned 42 degrees, with its grid and the street label turned with it

Turn the view

A right drag turns the picture about the mouse, and "[" and "]" turn it by 15°. The grid turns with it. Fitting a box takes the angle into account. Rotation is off unless you turn it on.

state vp = viewport.Viewport(content: plan(), rotates: true)
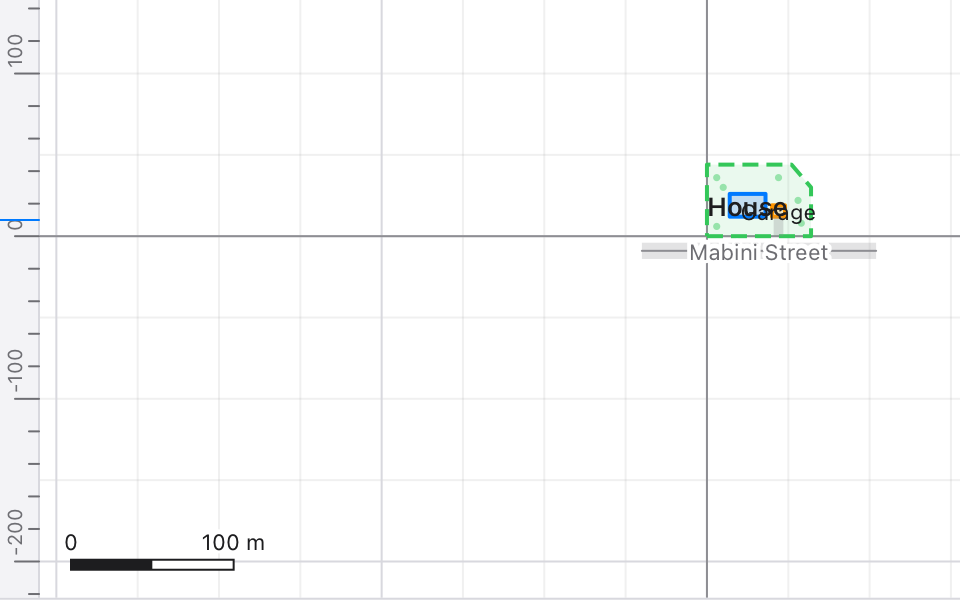
The site plan zoomed far out: grid lines every 100 metres and a scale bar reading 0 to 100 m

A grid that follows the zoom

Grid lines are a round step apart (1, 2 or 5 × 10ⁿ), with fainter lines between them and the axes drawn darker. The scale bar picks a round length and switches to km or mm when the numbers get large or small.

viewport.drawGrid(g, vp)
viewport.drawScaleBar(g, vp, x: 16, y: g.height - 14, unit: "m")
Rulers along the top and left of the plan, labelled 0, 20 and 40 metres, with blue marks where the mouse is

Rulers with a mark at the mouse

Rulers along the top and left edges, labelled in world units, with a blue mark where the mouse is. The labels use as many decimals as the step needs.

viewport.drawRulers(g, vp, mouseX: mouseX, mouseY: mouseY)

A whole app

Keep a Viewport in a state, give it the canvas's size, its events and a timer, and draw. apply(g) lets you draw in world units. You can also convert each point with toScreen.

A plan in metres

Y grows upwards, as in drawings and maps. Set yDown: true for pictures and pages.

import viewport

app Plan(width: 700, height: 480) {
    state vp = viewport.Viewport(content: viewport.box(0, 0, 60, 40))

    Canvas { g in
        viewport.drawGrid(g, vp)
        g.save()
        vp.apply(g)                     // draw in metres from here
        g.strokeRect(x: 10, y: 10, width: 20, height: 12, color: .blue, lineWidth: 2)
        g.restore()
        viewport.drawZoomBox(g, vp)
        viewport.drawScaleBar(g, vp, x: 16, y: g.height - 14, unit: "m")
    }
    .onResize { w, h in vp.resize(w, h) }
    .onPointer { e in
        let _used = vp.handle(e)
    }
    .onKey { key in
        let _used = vp.handleKey(key)
    }
    .onAppear {
        every(seconds: 1.0 / 60.0) { vp.tick() }    // smooth moves
    }
}

Next to your own tools

handle(e) returns false for the events it leaves alone, so the app's tools get them, with the world point under the mouse.

state vp = viewport.Viewport(minScale: 0.01, maxScale: 1000.0,
                             content: drawingBox(),
                             keepInSight: true,
                             leftDragPans: false)   // left drags draw

.onPointer { e in
    if !vp.handle(e) {
        let (x, y) = vp.toWorld(e.x, e.y)
        myTool(e, x, y)
    }
}

// Snap within 8 points, whatever the zoom.
let snap = vp.length(8.0)

// Draw only what shows.
let seen = vp.visible()
for s in shapes {
    if s.bounds.intersects(seen) { draw(g, s) }
}

The mouse and keys

What handle(e) and handleKey(key) do, and the fields that change it.

InputWhat it doesField
Wheel, two-finger scrollZooms about the mouse. With Cmd or Option held, it pans.wheel: .pans swaps the two
PinchZooms about the mouse.
Left dragPans.leftDragPans: false leaves left drags to the app
Middle dragPans.
Shift and a left dragDraws a zoom box and zooms into it.boxZoom
Right dragTurns the picture about the mouse.rotates: true (off by default)
Double clickFits the content.doubleClickFits
+ or =, −Zooms in and out by zoomStep (1.5).
0Fits the content.
ArrowsPan by an eighth of the canvas.
[ and ]Turn by rotateStep (15°).rotates: true

Fitting, the zoom buttons and the zoom box move over a quarter of a second, fast at first and slowing at the end. A zoom keeps its fixed point still the whole way. Moves are timed by tick() calls, not by the clock, so headless tests run them too. With smooth: false, every move happens at once. Zooming with the wheel is never smoothed, so the view keeps up with the mouse.

Checked against a second model

A Python program works out every view a different way, as a 3×3 matrix, for random views put through random pans, zooms, turns, resizes, fits and zoom boxes. The library has to agree with it on every value.

33,130checks in the library's tests, all passing
1,500random views put through 9,587 random moves
22UI checks driving the example app headless with the mouse, keys and buttons
3files of Tessel, nothing else to install

Reference

Coordinates

Field or method
width, heightThe canvas's size in points. Set them with resize(w, h) from .onResize.
centerX, centerYThe world point in the middle of the canvas.
scalePoints per unit of the world: 20 means a metre is drawn 20 points long.
angleHow far the picture is turned, counterclockwise, in radians.
yDownfalse (the default): y grows upwards. true: downwards, as in pictures.
toScreen(x, y), toWorld(sx, sy)A world point on the canvas, and a point of the canvas in the world.
screenX, screenY, worldX, worldYOne coordinate of those, for use inside expressions.
toScreenPoints(points)Many points (x, y, x, y, …) on the screen, ready for g.lines.
points(length), length(points)A world length in points, and back.
visible(), onScreen(box)The world box the canvas shows, and the screen box around a world box.
apply(g)Sets the canvas's transform so that what follows is drawn in world units.

Moving

Method
pan(dx, dy)Moves the picture by screen points.
zoom(by: f, sx, sy)Zooms about a point of the canvas.
zoomCentered(by:), setScale(s), zoomIn(), zoomOut()Zoom about the middle.
rotate(by: a, sx, sy), setAngle(a)Turn about a point, or to an angle about the middle.
centerOn(x, y), show(x, y, scale, angle)Go to a place.
fit(box), fitContent()Show all of a box, margin points (20) from the edges.
zoomToScreenBox(x1, y1, x2, y2)Zooms into a rectangle of the canvas.
tick(), finish(), stop()Run a smooth move on by a sixtieth of a second, jump to its end, or leave the view where it is.

Limits: minScale and maxScale stop the zoom. content is the box around your drawing (viewport.box(x1, y1, x2, y2) or viewport.boxAround(points)). The first resize fits it, and with keepInSight: true a pan or zoom stops while sight points (40) of it still show.

Drawing

Function
drawGrid(g, vp, spacing:, color:, minorColor:, axisColor:)Grid lines at least spacing points (100) apart, and the axes.
drawRulers(g, vp, size:, mouseX:, mouseY:)Rulers along the top and left, with a mark at the mouse. Not drawn while the view is turned.
drawScaleBar(g, vp, x:, y:, maxWidth:, unit:)A map's scale bar at most maxWidth points (120) long.
scaleBar(vp, maxWidth:, unit:)That bar's length, size in points and label, to draw your own.
drawZoomBox(g, vp)The zoom box while it's dragged.
gridStep(vp, spacing:), niceStep(x), tickLabel(value, step:)The grid's step (for snapping), a round step, and a number labelled as the rulers do.